Intro to R

Data Science Salon - Session 1

Eve Perry

September 27, 2023

Outline

  • Preview of workshops
  • R workflow
  • Differences between R and Stata

Preview of Workshops

Planned Workshops

  • R Basics
  • “Tidy” Data
  • Data Wrangling in R
  • Visualizing Data in R
  • Communicating with R
  • Modeling with R
  • Programming with R

R Workflow

Whole Game

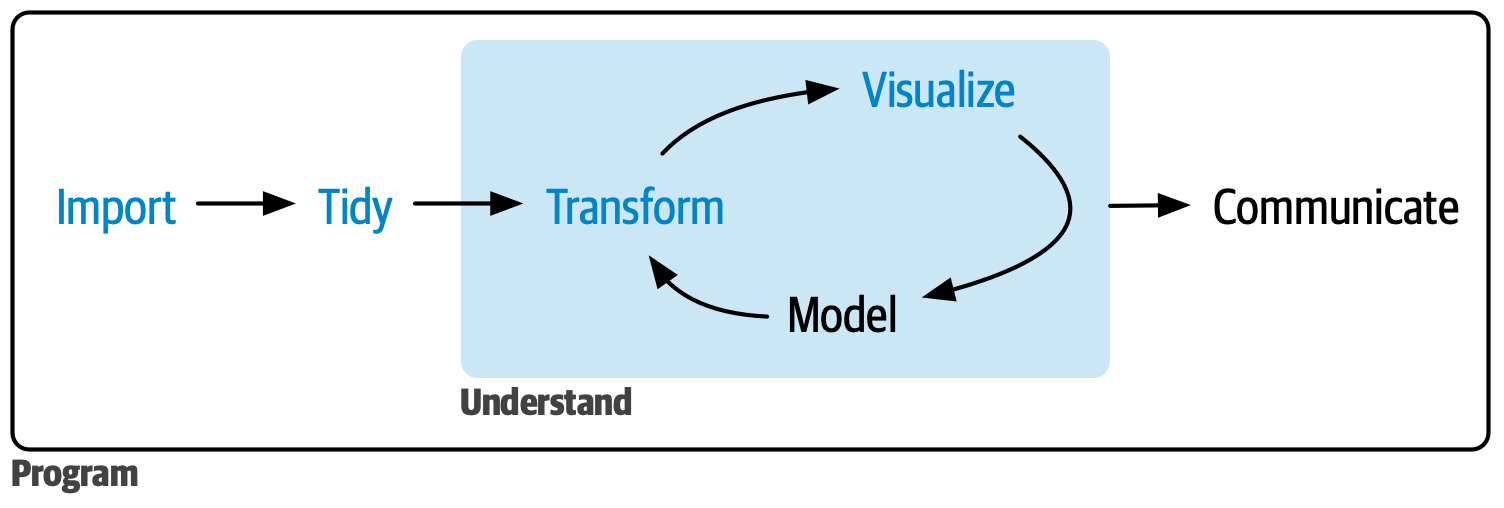
Data Science Workflow in R (via Hadley Wickham)

Import

Reading in flat files

read_csv("example.csv")
read_dta("example.dta")

Connect directly to SQL databases

con <- DBI::dbConnect(RMariaDB::MariaDB(), group = "my-db")
tbl(con, "example")

Fetch data from APIs

bhhi_rc_read("EXAMPLE")

Tidy

Making messy data neat, so you can use it

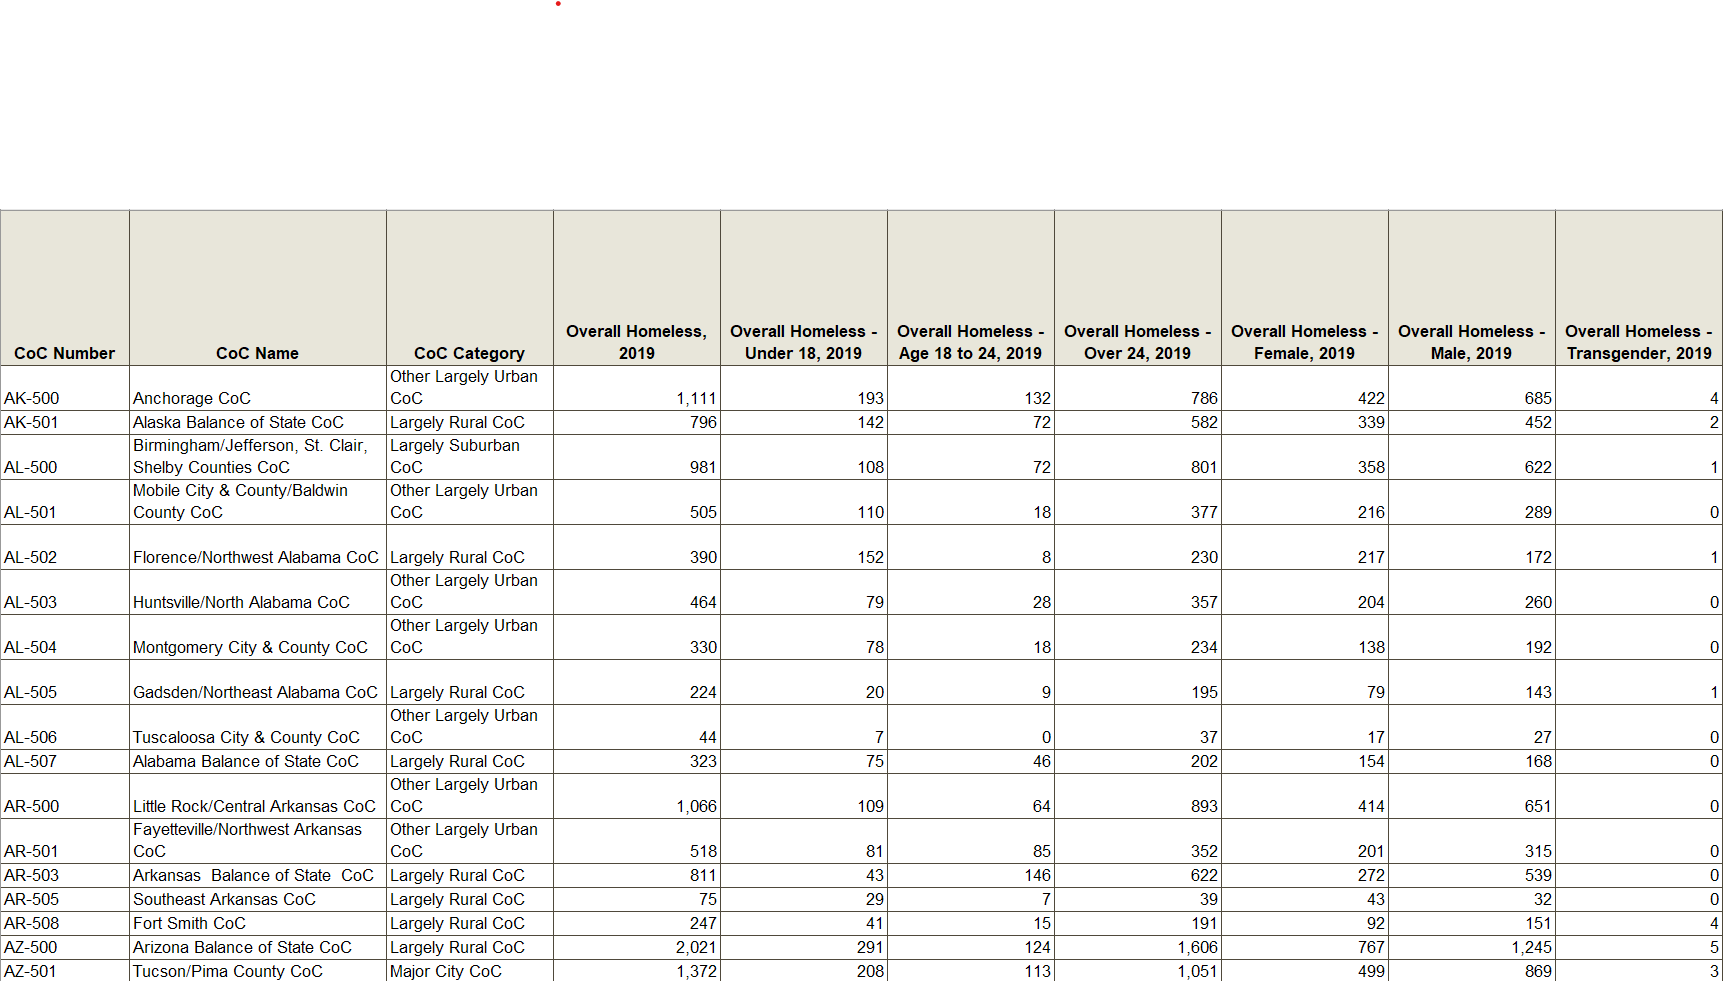
Raw Data in Spreadsheet

Tidied Data in R

Transform

Filtering and sorting rows

take_home_data |>
  filter(region == "West") |>
  arrange(peh_count)

Adding, changing, and selecting columns

take_home_data |>
  mutate(
    homelessness_rate = peh_count / population,
    homelessness_rate = homelessness_rate * 100
  ) |>
  select(city, homelessness_rate, average_rent)

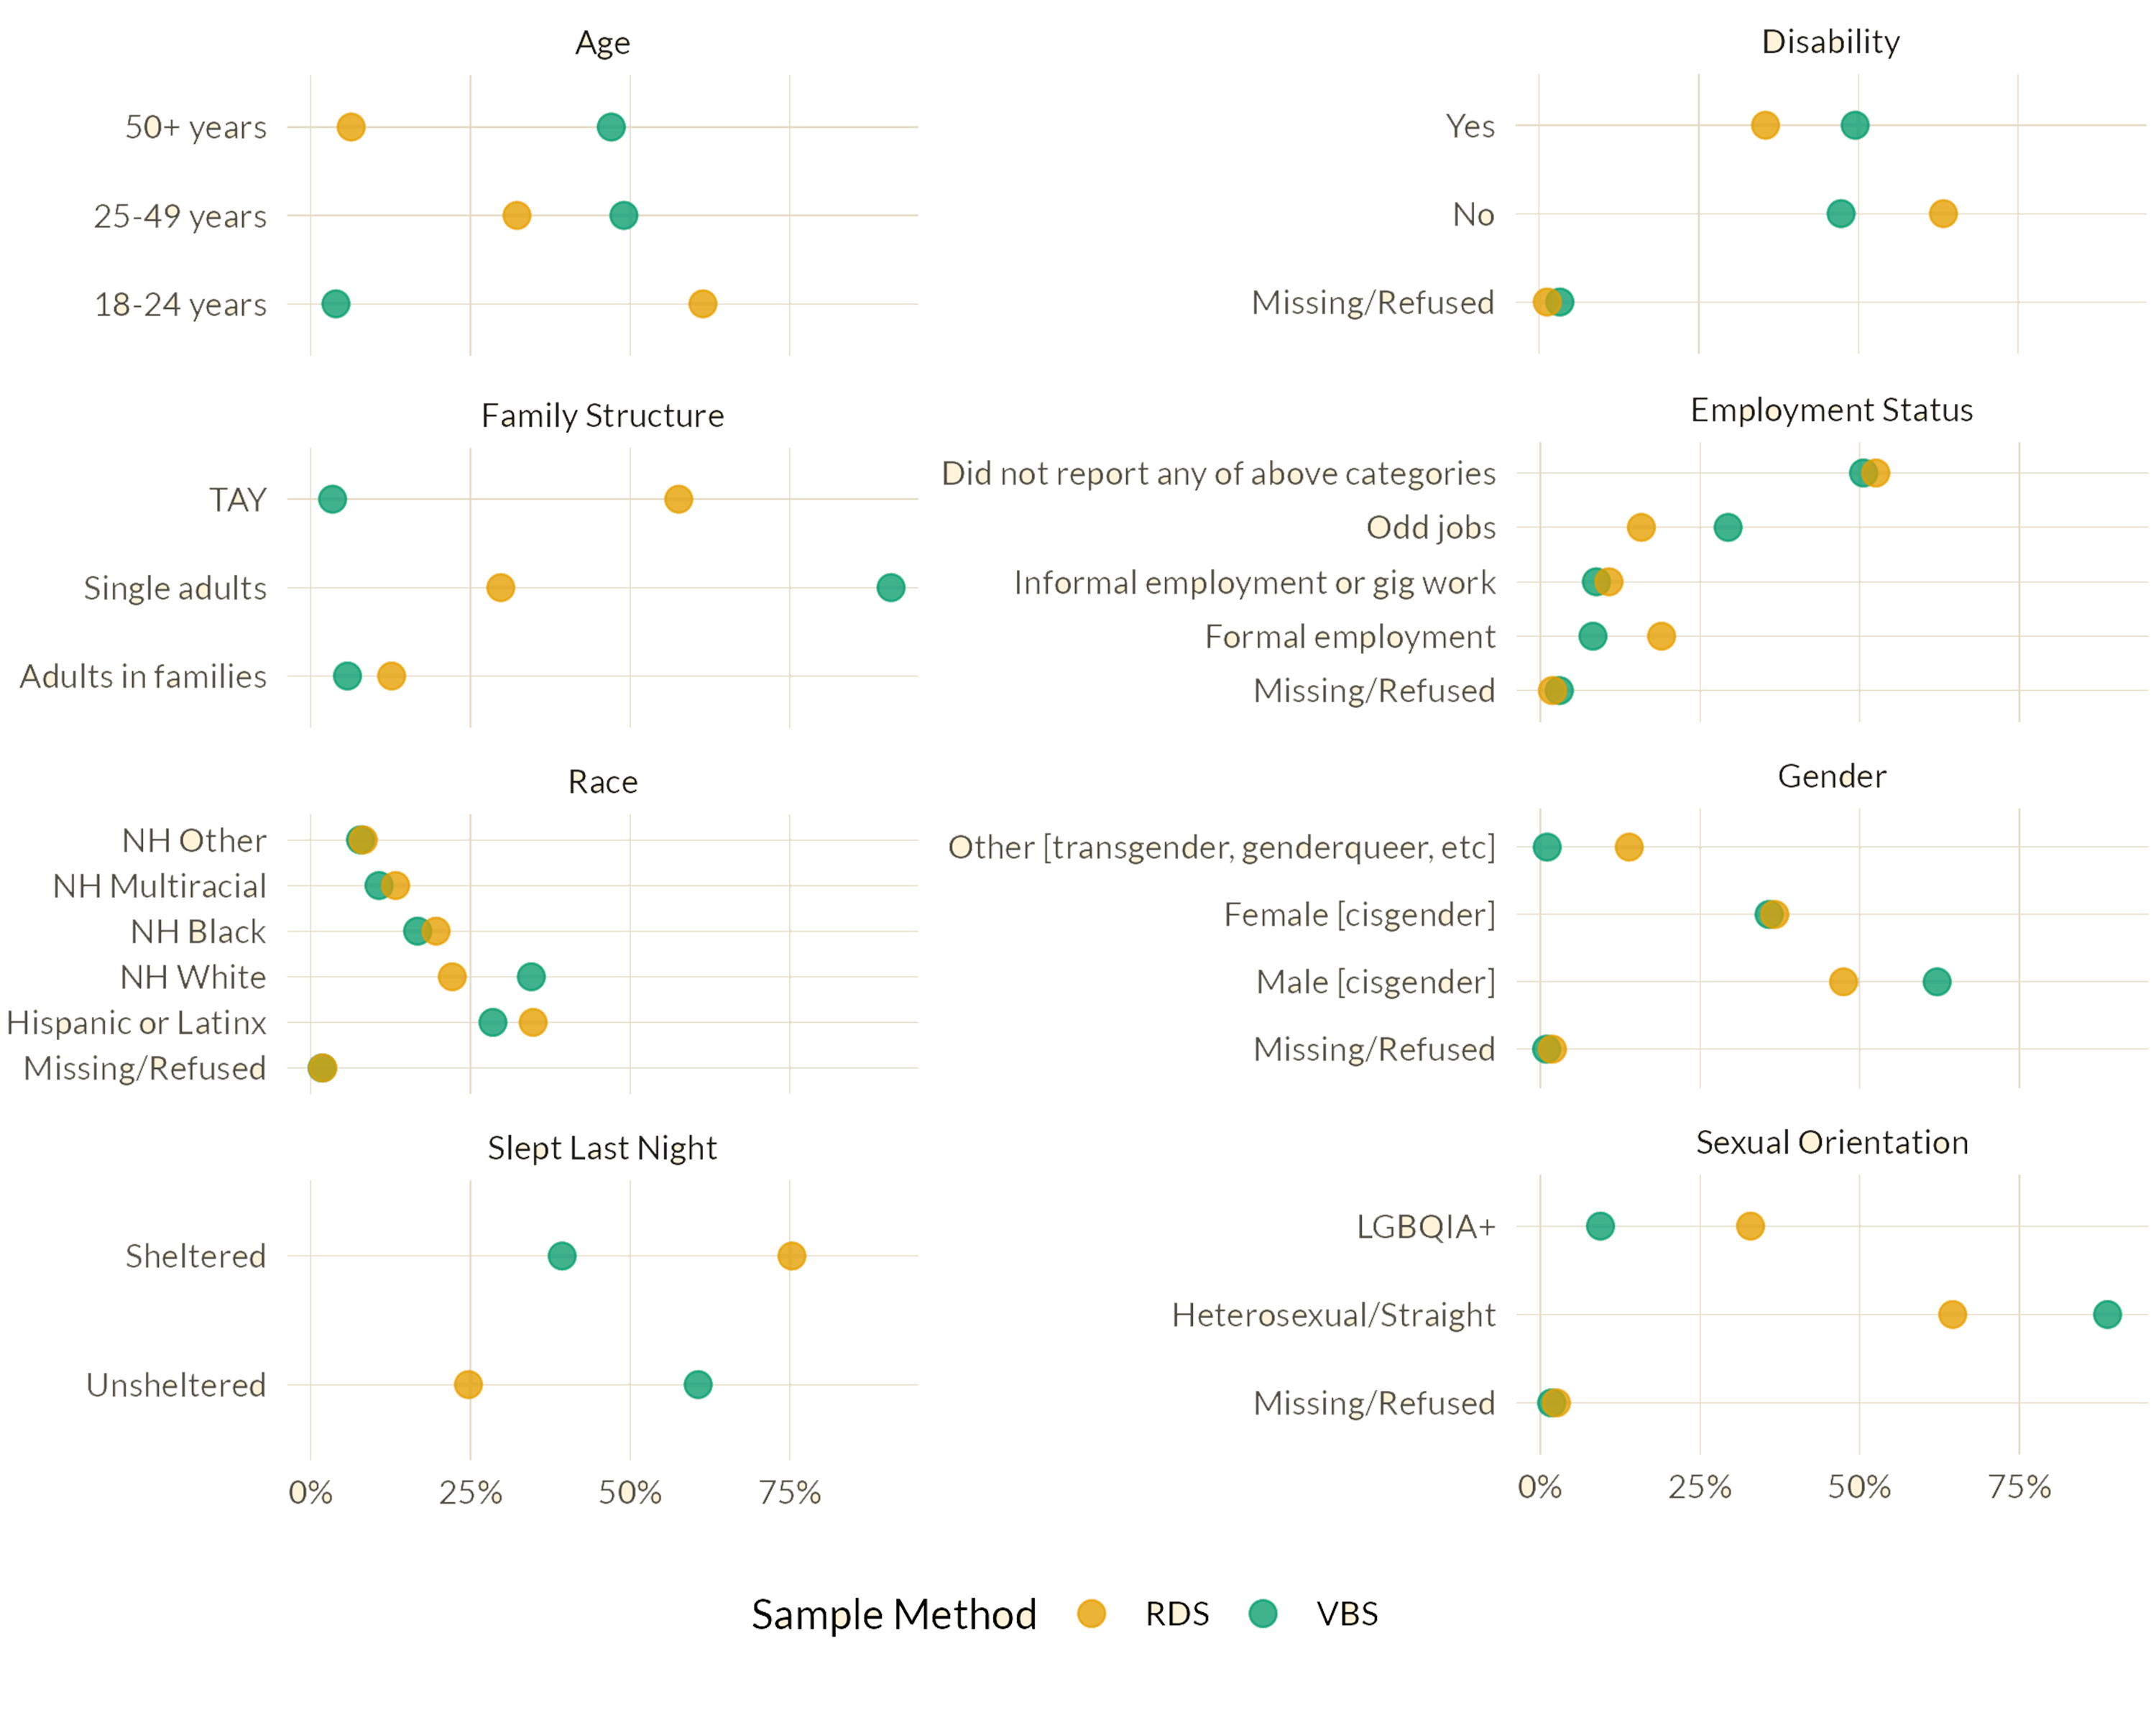
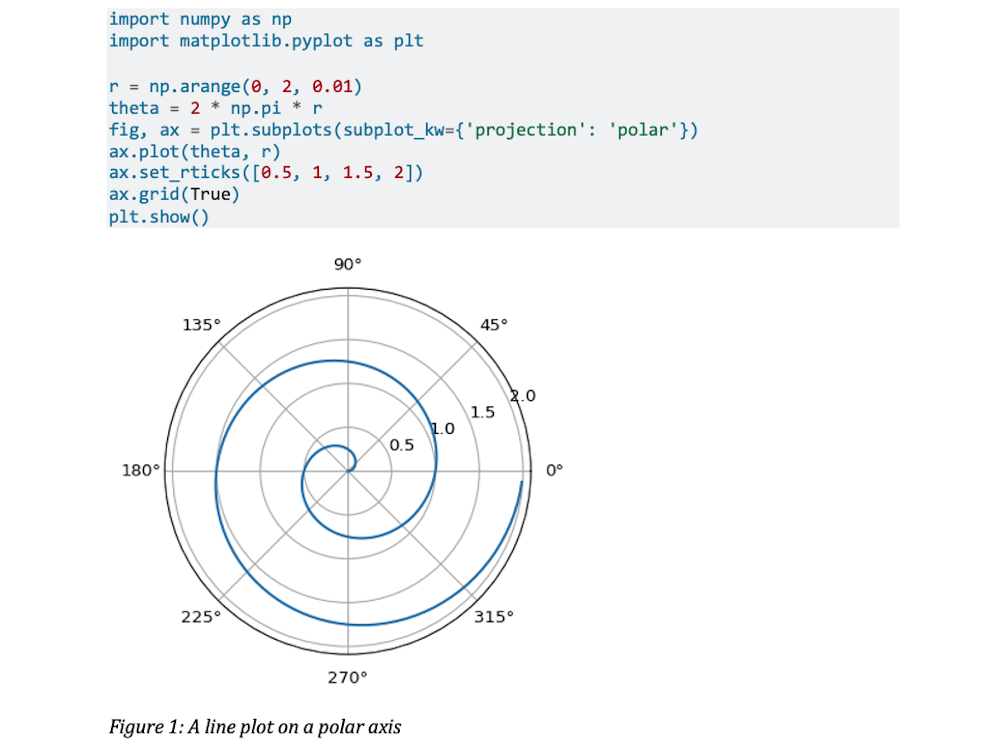
Visualize

Model

  • All the standard regression models and diagnostics

  • Cutting edge survey data modeling

  • Easy to use machine learning tools

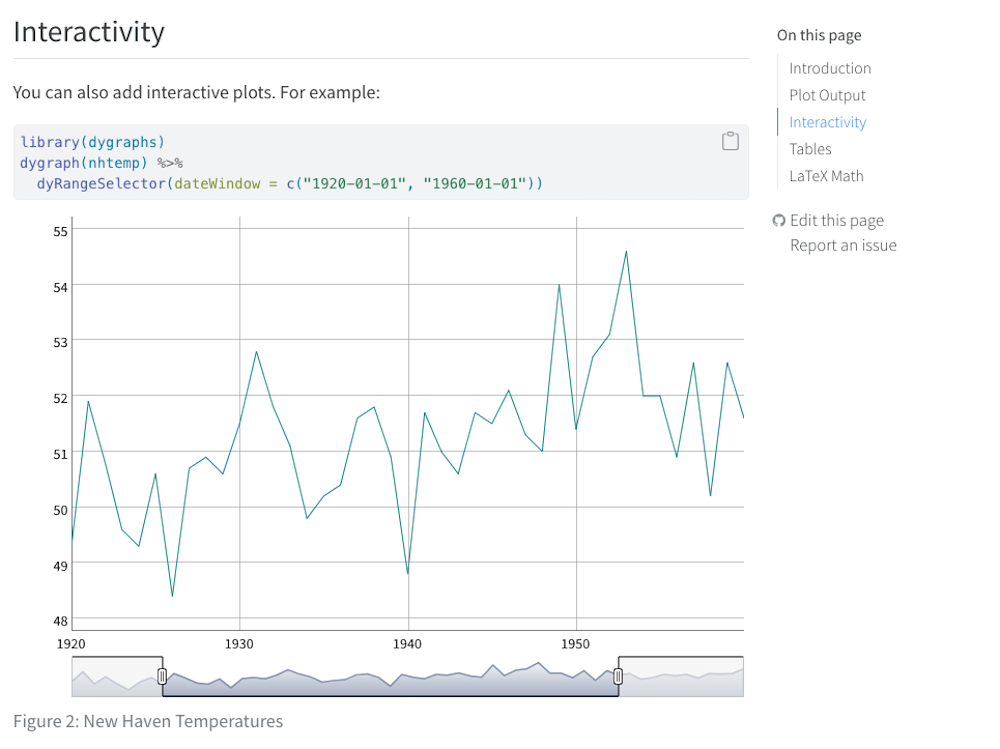
Communicate

Webpage

Web Presentations

PDF

Powerpoint

Word Documents

Google Drive

Differences Between Stata & R

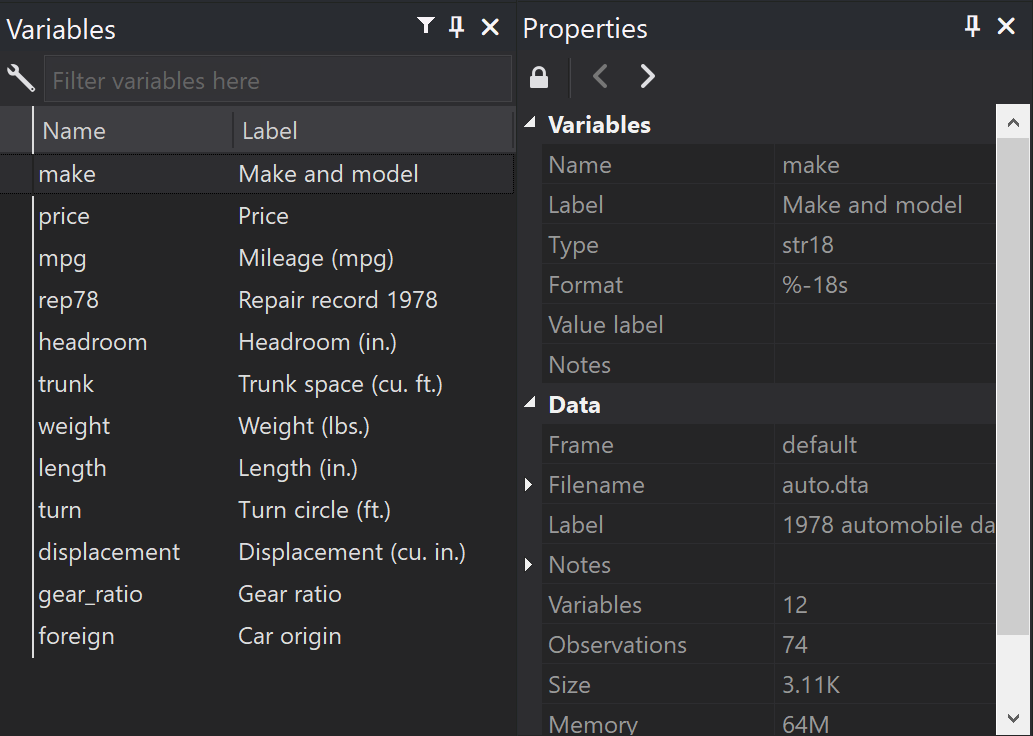
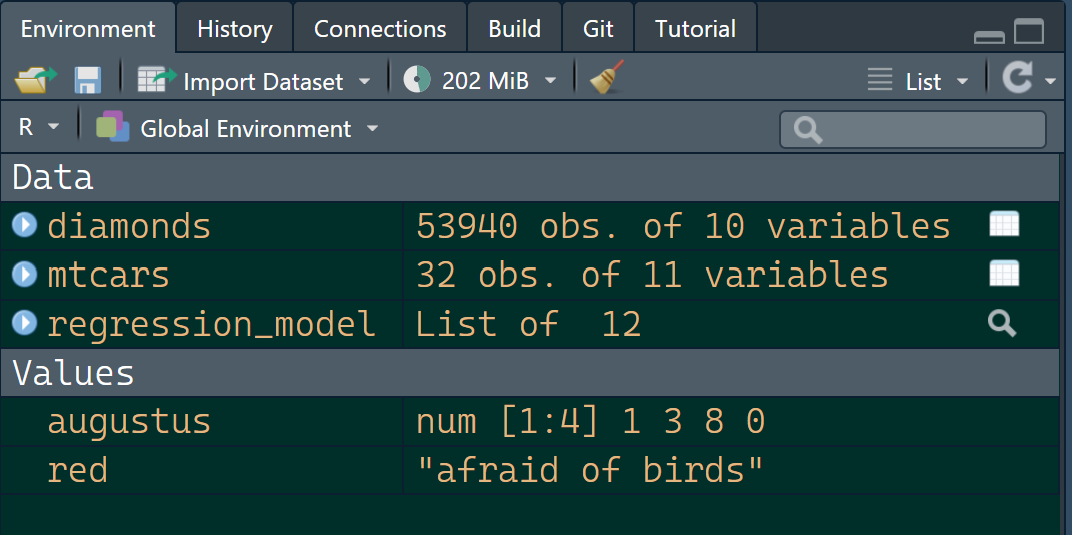
Datasets vs. Objects

Stata

R

Commands vs. Functions

Stata

sysuse auto
gen test = 1
replace mpg = 90

sum test mpg
    Variable |        Obs        Mean    Std. dev.       Min        Max
-------------+---------------------------------------------------------
        test |         74           1           0          1          1
         mpg |         74          90           0         90         90

Commands vs. Functions

R

mutate(cars, test = 1, mpg = 90)
# A tibble: 32 × 12
    mpg   cyl  disp    hp  drat    wt  qsec    vs    am  gear  carb  test
  <dbl> <dbl> <dbl> <dbl> <dbl> <dbl> <dbl> <dbl> <dbl> <dbl> <dbl> <dbl>
1    90     6   160   110  3.9   2.62  16.5     0     1     4     4     1
2    90     6   160   110  3.9   2.88  17.0     0     1     4     4     1
3    90     4   108    93  3.85  2.32  18.6     1     1     4     1     1
4    90     6   258   110  3.08  3.22  19.4     1     0     3     1     1
5    90     8   360   175  3.15  3.44  17.0     0     0     3     2     1
# ℹ 27 more rows
cars
# A tibble: 32 × 11
    mpg   cyl  disp    hp  drat    wt  qsec    vs    am  gear  carb
  <dbl> <dbl> <dbl> <dbl> <dbl> <dbl> <dbl> <dbl> <dbl> <dbl> <dbl>
1  21       6   160   110  3.9   2.62  16.5     0     1     4     4
2  21       6   160   110  3.9   2.88  17.0     0     1     4     4
3  22.8     4   108    93  3.85  2.32  18.6     1     1     4     1
4  21.4     6   258   110  3.08  3.22  19.4     1     0     3     1
5  18.7     8   360   175  3.15  3.44  17.0     0     0     3     2
# ℹ 27 more rows

Commands vs. Functions

R

cars = mutate(cars, test = 1, mpg = 90)
cars
# A tibble: 32 × 12
    mpg   cyl  disp    hp  drat    wt  qsec    vs    am  gear  carb  test
  <dbl> <dbl> <dbl> <dbl> <dbl> <dbl> <dbl> <dbl> <dbl> <dbl> <dbl> <dbl>
1    90     6   160   110  3.9   2.62  16.5     0     1     4     4     1
2    90     6   160   110  3.9   2.88  17.0     0     1     4     4     1
3    90     4   108    93  3.85  2.32  18.6     1     1     4     1     1
4    90     6   258   110  3.08  3.22  19.4     1     0     3     1     1
5    90     8   360   175  3.15  3.44  17.0     0     0     3     2     1
# ℹ 27 more rows
Packages

Stata

ssc install outreg

R

install.packages("dplyr")
library(dplyr)

R Resources for Stata Users