Uses bhhi_cascade() with srvyr::survey_prop() to calculate weighted
crosstabs and then uses bhhi_format_crosstab() to create nicely formatted
output via the gt table package.
Usage
bhhi_gt_crosstab(
  .data,
  row_var,
  col_var,
  pct_direction = "col",
  add_n = FALSE,
  vartype = c("se", "ci", "var", "cv"),
  level = 0.95,
  proportion = TRUE,
  decimals = 1,
  convert_labelled = TRUE,
  na.rm = FALSE
)
Arguments
- .data
tbl A
tbl_svyobject- row_var
Variable to show in the rows in output.
- col_var
Variable to show in the columns in output.
- pct_direction
'col'to calculate column percentages or'row'to calculate row percentages. Defaults to'col'.- add_n
Add cell N to output. Defaults to FALSE.
- vartype
Report variability as zero or more of: standard error ("se", default), confidence interval ("ci"), variance ("var") or coefficient of variation ("cv"). Defaults to hiding variability.
- level
(For vartype = "ci" only) A single number or vector of numbers indicating the confidence level
- proportion
Use methods to calculate the proportion that may have more accurate confidence intervals near 0 and 1. Based on
svyciprop.- decimals
An integer specifing the number of decimal places in the results. Defaults to 1.
- convert_labelled
If either
row_varorcol_varishaven::labelled, automatically convert to factor. Defaults to TRUE.- na.rm
Drop missing values. Defaults to FALSE.
Examples
data("nhanes", package = "survey")

survey_object <- nhanes |>
  dplyr::rename(gender = RIAGENDR) |>
  dplyr::mutate(
    gender = factor(gender, 1:2, c("Male", "Female")),
    race = factor(race, 1:4, c("Hispanic", "White", "Black", "Other"))
  ) |>
  srvyr::as_survey(weights = WTMEC2YR)

survey_object |>
  bhhi_gt_crosstab(race, gender)

 survey_object_labelled <- nhanes |>
  dplyr::rename(gender = RIAGENDR) |>
  dplyr::mutate(
    gender = factor(gender, 1:2, c("Male", "Female")),
    race = factor(race, 1:4, c("Hispanic", "White", "Black", "Other")),
    dplyr::across(c(gender, race), labelled::to_labelled)
  ) |>
  srvyr::as_survey(weights = WTMEC2YR)

  survey_object_labelled |>
  bhhi_gt_crosstab(race, gender)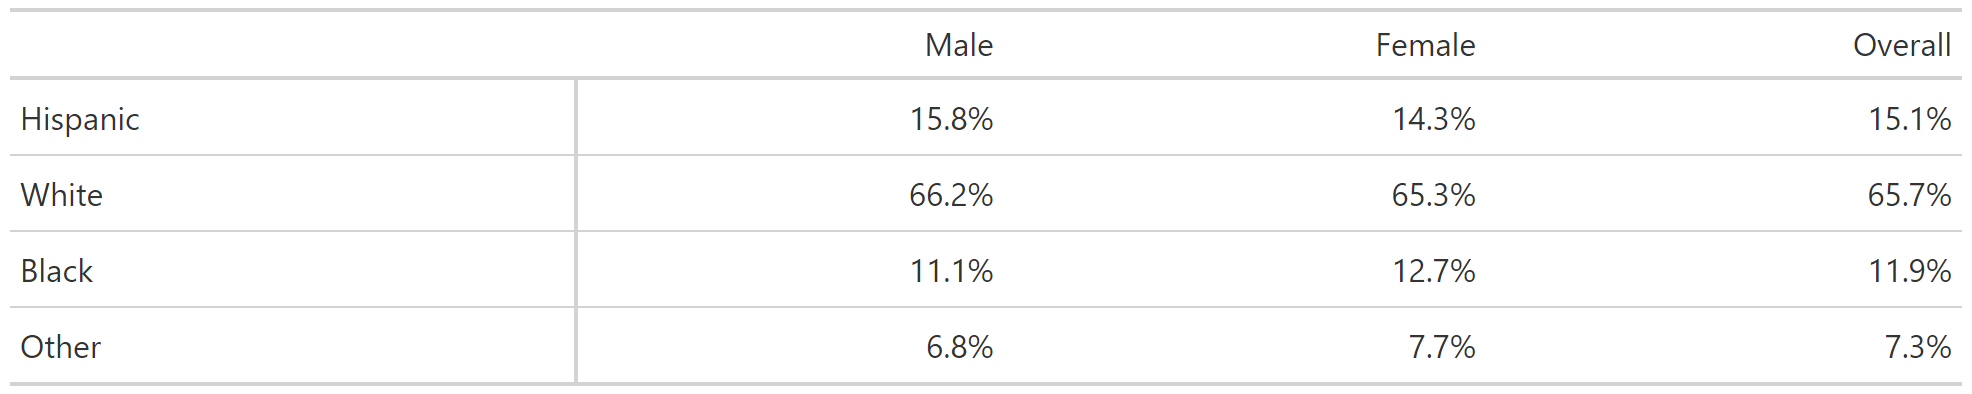
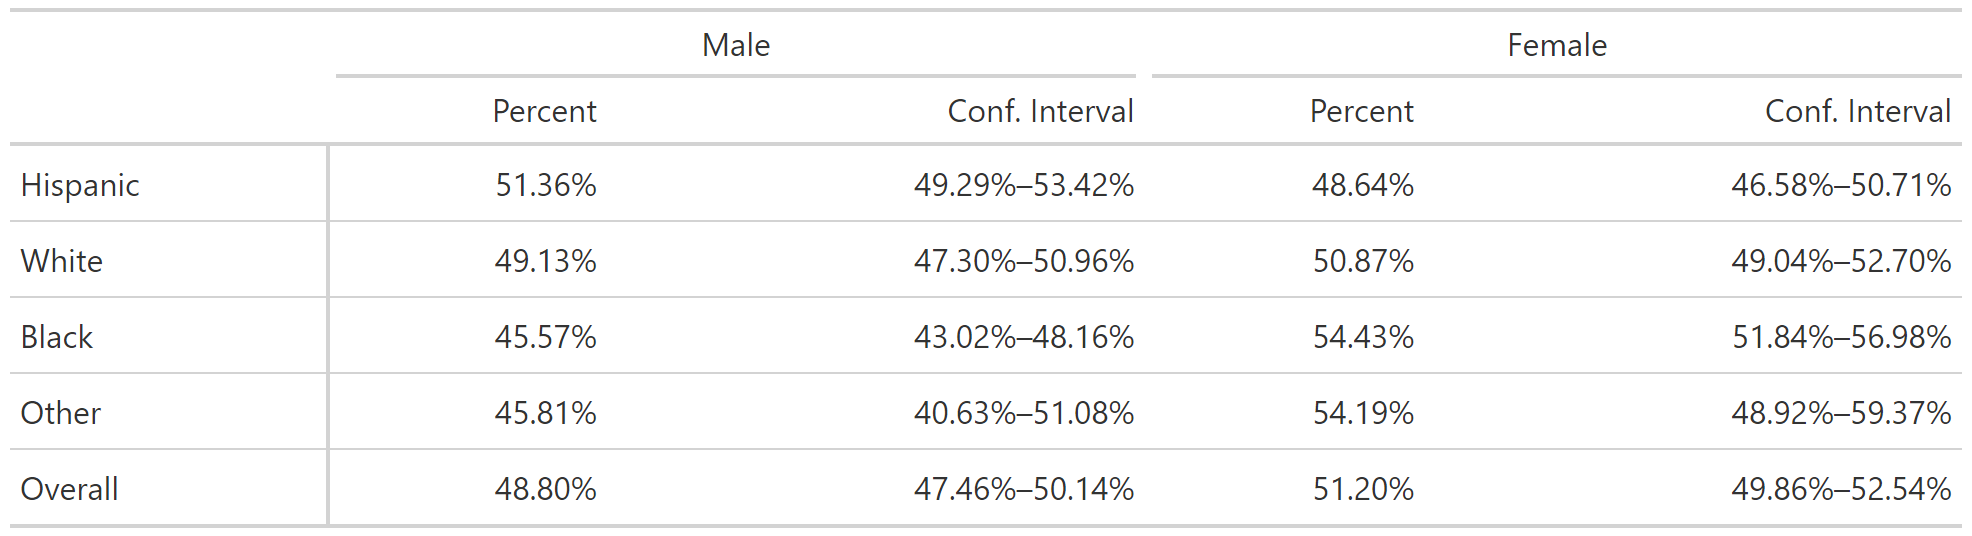
survey_object |>
  bhhi_gt_crosstab(
    race, gender, pct_direction = "row", vartype = "ci", decimals = 2
  )