Data Introduction
| Rows | 3,659 |
| Columns | 41 |
| Discrete columns | 3 |
| Continuous columns | 38 |
| All missing columns | 0 |
| Total missing values | 10,633 |
| Complete rows | 209 |
| Total observations | 150,019 |
| Memory usage (kb) | 1,301 |
CoC Map
People experiencing homelessness per 1,000 people in CoC population, 2019Summary Statistics
| Variable | Share missing | Mean | Median | Min | Max | 25th | 75th |
|---|---|---|---|---|---|---|---|
| avg_fmr0 | 0.01 | 693 | 620 | 373 | 2,069 | 526 | 800 |
| avg_fmr1 | 0.01 | 792 | 708 | 437 | 2,561 | 602 | 922 |
| avg_fmr2 | 0.01 | 979 | 874 | 529 | 3,170 | 754 | 1,125 |
| avg_fmr3 | 0.01 | 1,302 | 1,174 | 680 | 4,153 | 1,004 | 1,502 |
| avg_fmr4 | 0.01 | 1,502 | 1,371 | 759 | 4,829 | 1,123 | 1,731 |
| avg_renter_share | 0.01 | 0.34 | 0.33 | 0.14 | 0.69 | 0.28 | 0.38 |
| coc_pop | 0.01 | 775,929 | 458,982 | 24,075 | 10,931,461 | 248,102 | 836,785 |
| coc_poverty_pop | 0.01 | 111,532 | 59,547 | 2,788 | 1,889,283 | 30,452 | 109,229 |
| coc_poverty_rate | 0.01 | 0.14 | 0.14 | 0.03 | 0.40 | 0.11 | 0.17 |
| coc_rent_zillow | 0.65 | 1,499 | 1,384 | 671 | 6,346 | 1,159 | 1,685 |
| coc_share_na_rent_zillow | 0.01 | 0.52 | 0.59 | 0.00 | 1 | 0.00 | 1.00 |
| coc_unemployment_rate | 0.01 | 0.07 | 0.06 | 0.02 | 0.28 | 0.05 | 0.08 |
| eviction_filing_rate | 0.79 | Inf | 0.06 | 0.00 | Inf | 0.03 | 0.09 |
| eviction_filings | 0.01 | 1,201 | 0.00 | 0.00 | 80,003 | 0.00 | 0.00 |
| eviction_rate | 0.80 | 0.03 | 0.03 | 0.00 | 0.15 | 0.02 | 0.05 |
| evictions | 0.01 | 567 | 0.00 | 0.00 | 30,671 | 0.00 | 0.00 |
| family_income | 0.01 | 71,707 | 66,908 | 41,136 | 160,810 | 59,066 | 80,144 |
| gross_vacancy_rate | 0.01 | 0.13 | 0.11 | 0.03 | 0.58 | 0.08 | 0.15 |
| homeless_per_1000_in_poverty | 0.05 | 15 | 10 | 0.54 | 267 | 6 | 17 |
| homeless_per_1000_total_pop | 0.05 | 2 | 1 | 0.11 | 30 | 0.82 | 2 |
| homeless_rate_in_poverty | 0.05 | 0.01 | 0.01 | 0.00 | 0.27 | 0.01 | 0.02 |
| homeless_rate_total_pop | 0.05 | 0.00 | 0.00 | 0.00 | 0.03 | 0.00 | 0.00 |
| household_income | 0.01 | 58,190 | 54,236 | 32,162 | 142,299 | 47,010 | 65,053 |
| individual_earnings | 0.01 | 32,028 | 30,630 | 16,696 | 72,069 | 27,306 | 35,170 |
| median_rent_burden | 0.01 | 0.31 | 0.31 | 0.24 | 0.44 | 0.29 | 0.33 |
| missing_evictions_rate | 0.01 | 0.87 | 1.00 | 0.00 | 1.00 | 1.00 | 1.00 |
| overall_homeless | 0.05 | 1,478 | 631 | 7 | 78,676 | 309 | 1,410 |
| pct_coc_na_fmr | 0.01 | 0.00 | 0.00 | 0.00 | 0.02 | 0.00 | 0.00 |
| rental_vacancy_rate | 0.01 | 0.07 | 0.06 | 0.02 | 0.25 | 0.05 | 0.08 |
| share_na_coc_unemployment_rate | 0.01 | 0.00 | 0.00 | 0.00 | 0.02 | 0.00 | 0.00 |
| share_rent_over_30_pct_inc | 0.01 | 0.51 | 0.51 | 0.36 | 0.69 | 0.48 | 0.54 |
| share_rent_over_50_pct_inc | 0.01 | 0.26 | 0.25 | 0.14 | 0.45 | 0.23 | 0.28 |
| shr_hh_with_pub_assist | 0.01 | 0.03 | 0.02 | 0.01 | 0.15 | 0.02 | 0.03 |
| shr_hh_with_snap | 0.01 | 0.12 | 0.12 | 0.02 | 0.43 | 0.09 | 0.15 |
| shr_hh_with_snap_or_pub_assist | 0.01 | 0.13 | 0.13 | 0.02 | 0.43 | 0.10 | 0.16 |
| shr_hh_with_ssi | 0.01 | 0.05 | 0.05 | 0.01 | 0.16 | 0.04 | 0.06 |
| shr_with_medicaid | 0.13 | 0.13 | 0.12 | 0.01 | 0.44 | 0.09 | 0.16 |
The observations with missing homelessness counts and rates are from CoCs that did not conduct a PiT count in a given year or result from the “shared jurisdiction” Massachusetts CoC which is present in the shapefiles but not in the PiT count data.
Correlation with Homelessness Rate
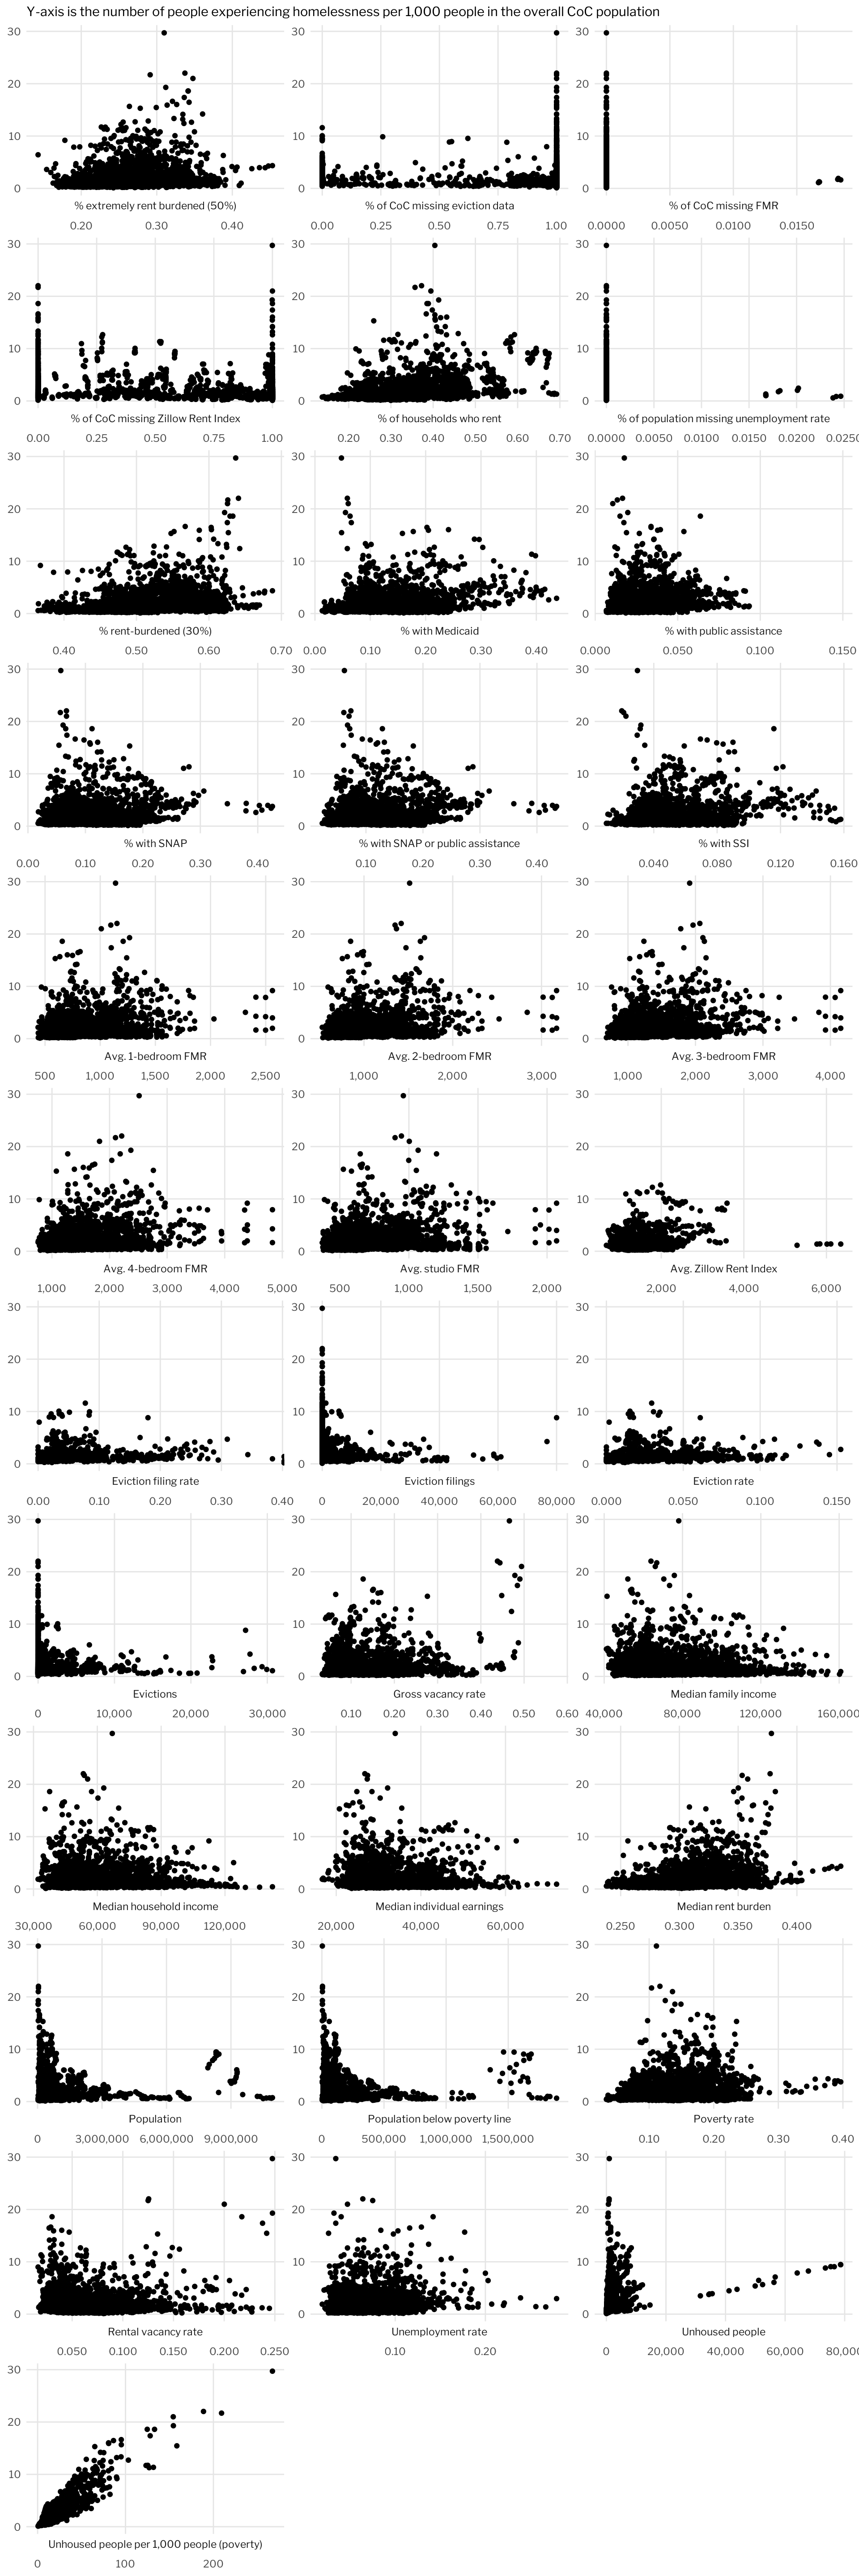
Scatterplots with Homelessness Rate
Dataset Correlation Grid
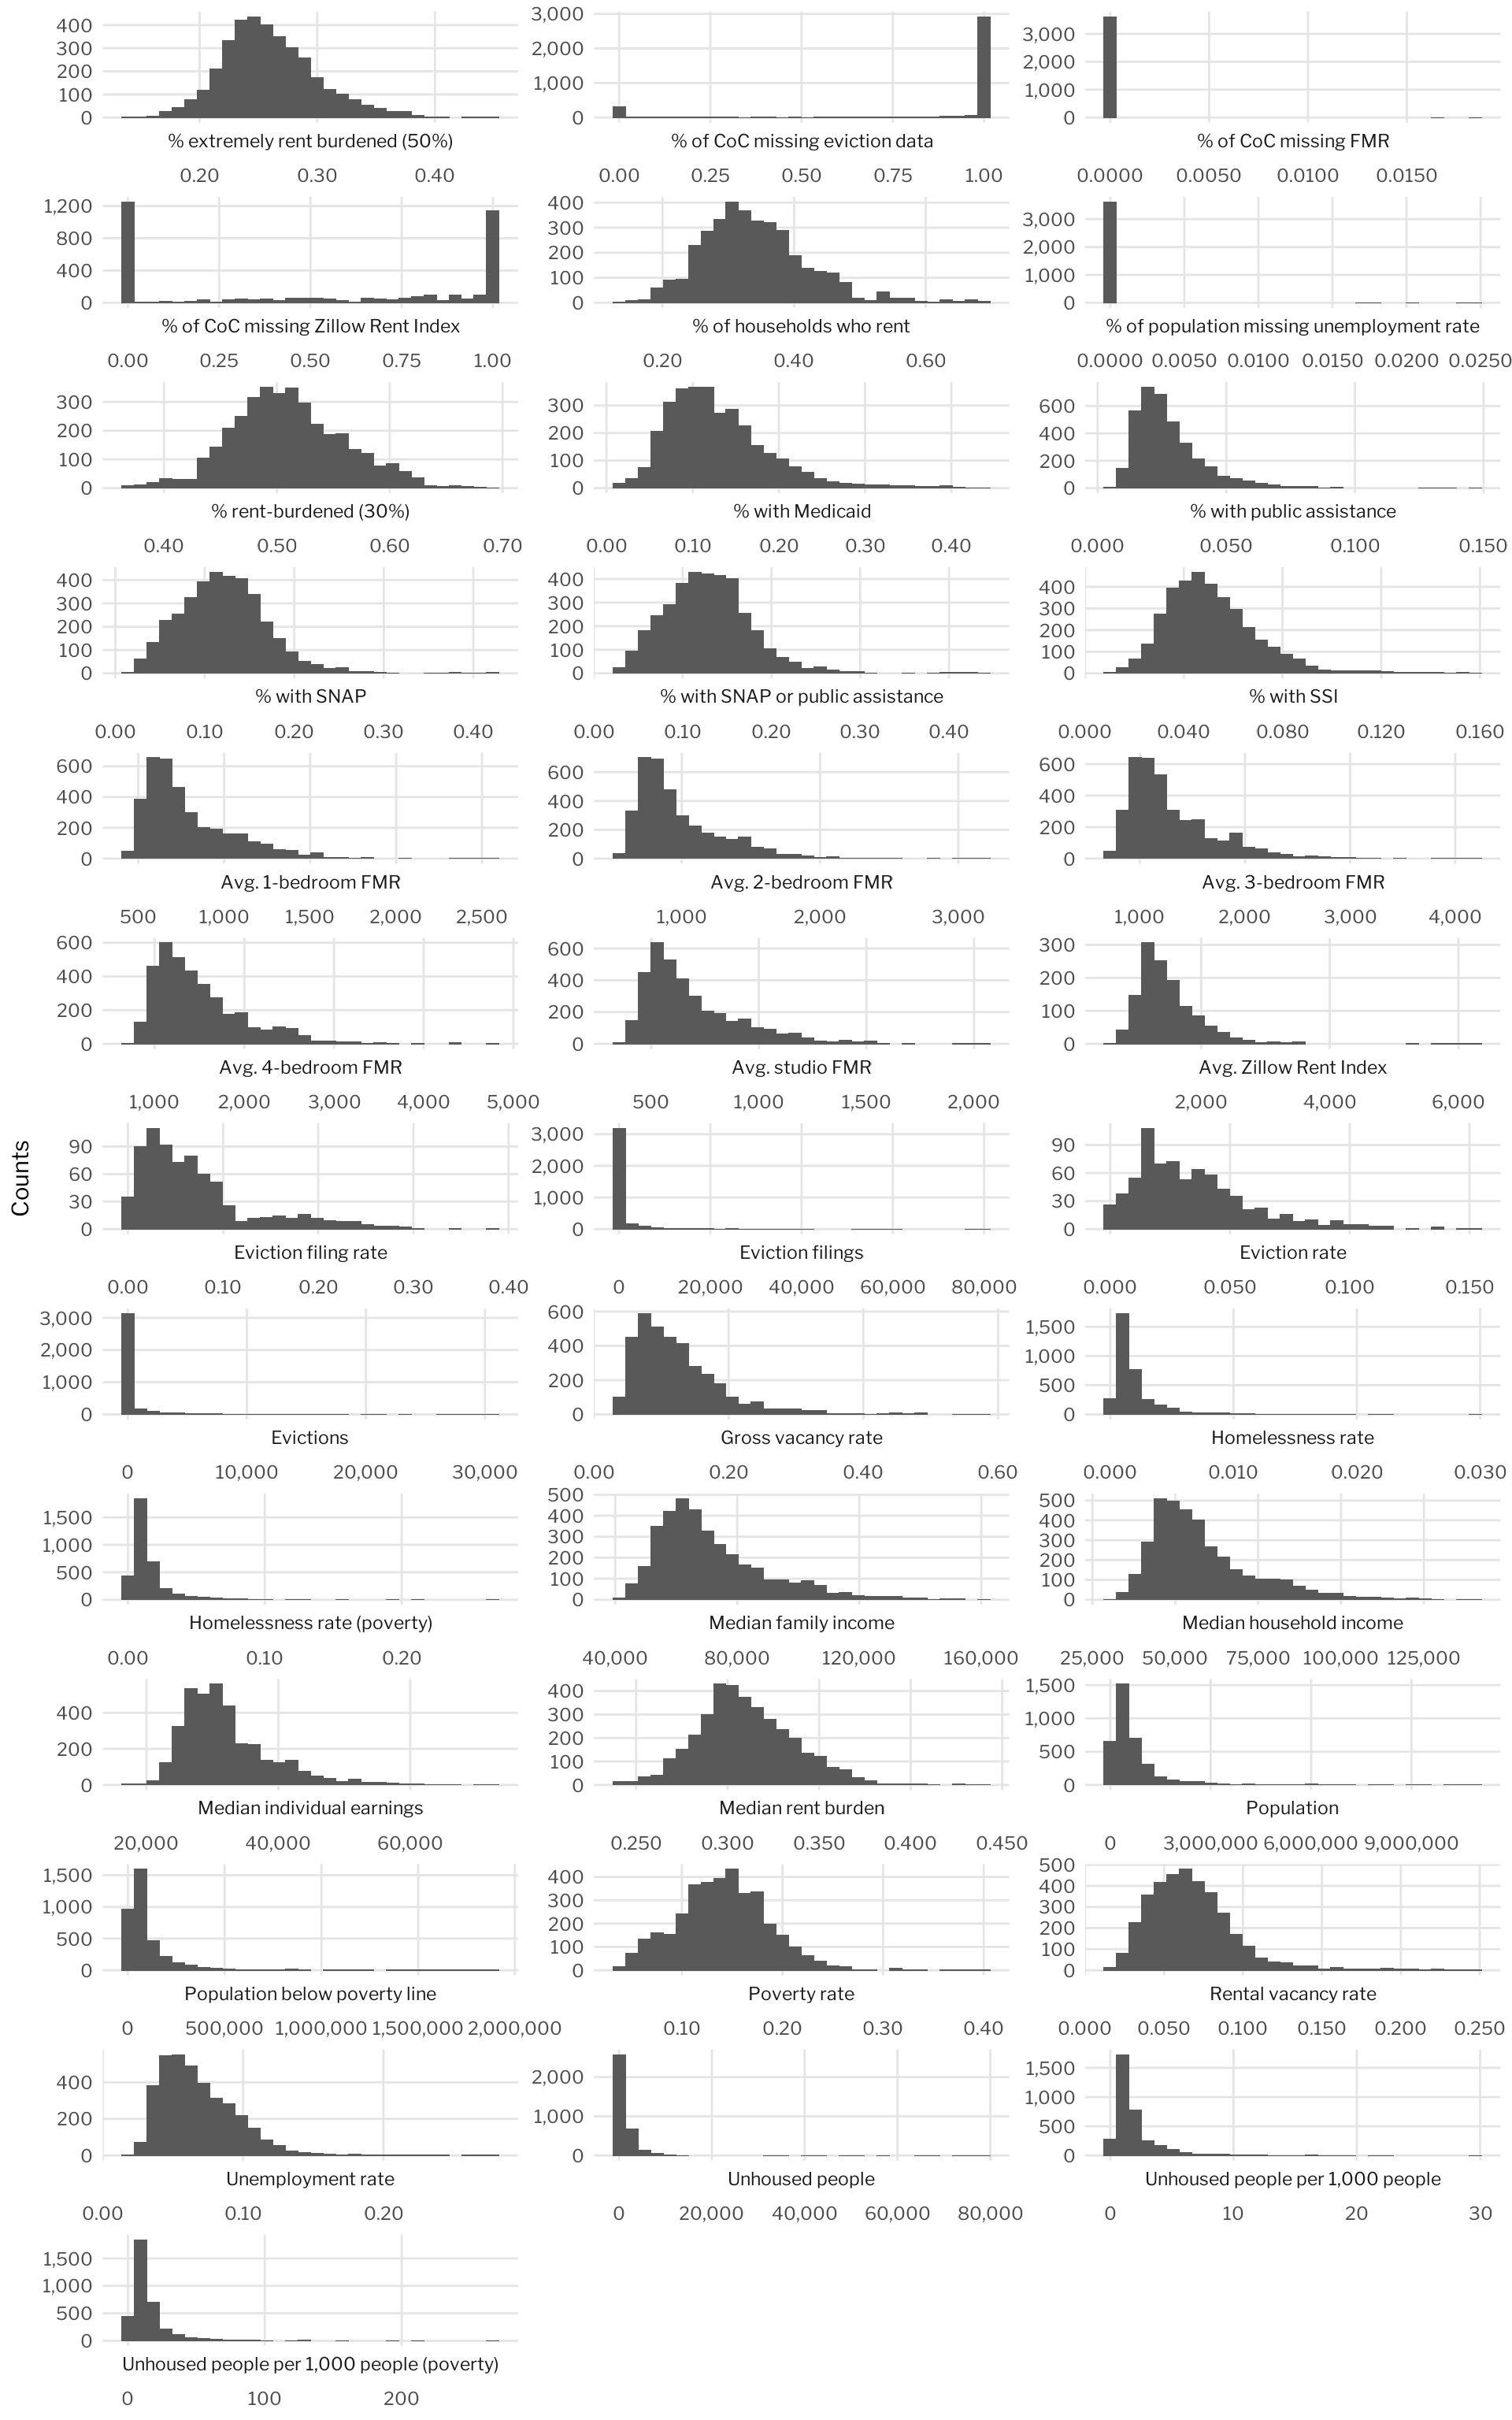
Histograms